


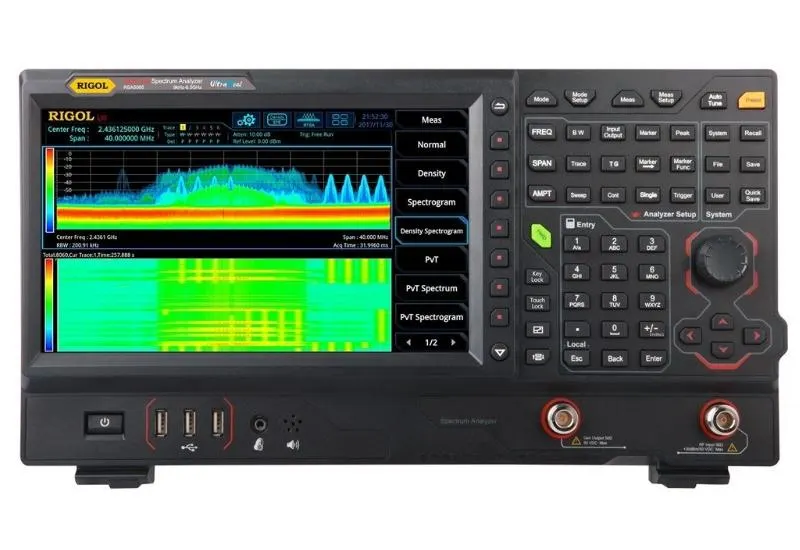
What a spectrum analyzer is
The spectrum analyzer represents the spectral components of a signal based on its Fourier transform.
This frequency-domain representation makes it possible to see signal parameters that would be hard to discover in the time domain with an oscilloscope.
It is especially useful for measuring the frequency response of telecommunications equipment (amplifiers, filters, couplers, etc.) and for checking the radio spectrum in an area with the help of an antenna.
On the screen, the amplitude or power of the signals is represented on the y axis and the frequency on the x axis. Power is given in dBm, a logarithmic unit relative to the milliwatt.
Description and operation
There is a wide variety of spectrum analyzers, of greater or lesser complexity, but all have basic functions and controls such as the following.
- Frequency (FREQUENCY). Sets the frequency window to display. You define the start and stop frequencies (START-STOP), or the center frequency with the SPAN, or window width.
- Amplitude (AMPLITUDE). Controls the amplitude representation of the input signal. It sets the reference value, the dBm per screen division and the input attenuation.
- View/Trace (VIEW/TRACE). Manages the representation of the measurement, including storing the maximum values at each frequency and storing a measurement for later comparison.
- Resolution filter/Averaging (BW/AVG). The analyzer captures the measurement by moving a narrow-bandwidth filter across the frequency window. The narrower its bandwidth, the better the resolution and the longer the measurement takes. This menu controls the filter and the calculation of averages (averaging).
- Marker/Peak search. Controls the position and function of the markers. A marker indicates the power of the trace at a given frequency. Peak search automatically places a marker at the highest power value in the window.
Use and measurements
Before configuring the analyzer, you must be clear about the signal to be measured: its power, bandwidth, center frequency, etc. You must also know which parameters you want to measure. For example, a wider frequency window is needed to measure harmonics and a narrower one to measure phase noise.
The frequency window is set in two ways: with the start and stop frequencies (START – STOP), or with a center frequency and a window around it, the SPAN. Defining a window with a start frequency of 150MHz and a stop frequency of 250MHz is equivalent to a center frequency of 200 MHz and a SPAN of 100MHz.
With the window set, the signal can normally be distinguished already. All that remains is to adjust the amplitude reference and the resolution in dBm/div so that the signal is well represented. Adjusting these values makes characteristics such as ripple and modulation easier to distinguish.
To obtain precise values, use the markers. They can be used in absolute mode (they give the direct measurement from the trace) or relative mode (they give the difference between two points). The choice depends on the measurement to be made.
Note: all spectrum analyzers have a maximum input power that must not be exceeded, generally +30dBm. Always check the manufacturer’s recommendations.