


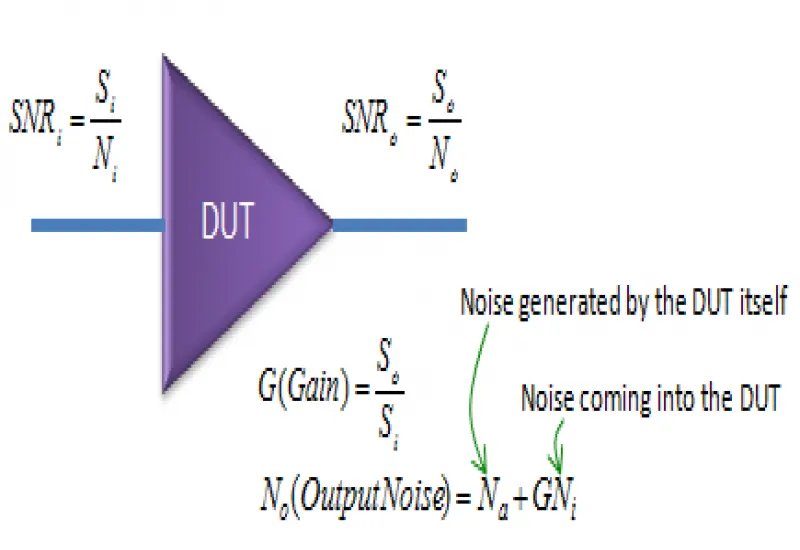
Gain and noise figure measurement by the Y method
We offer gain and noise figure measurements by the Y method (Y-Factor) to characterize the performance of receivers, amplifiers, RF modules and radio frequency electronic devices. We measure gain and noise figure up to 18 GHz with noise sources of ENR from 6 to 21 dB, which makes it possible to adapt the test to different devices and frequency ranges.
Results include plots of gain and noise figure as a function of frequency. These are used to evaluate the sensitivity, performance and noise behavior of the device under test. At the customer’s request, we complement the report with photographs and videos of the measurement procedure and with documentation of the conditions and setup used.
What noise figure is
Noise figure (NF) is a fundamental parameter for evaluating a receiver or RF device. It quantifies how much the signal-to-noise ratio of a signal degrades as it passes through the device. A lower noise figure generally indicates better performance and a greater ability to detect weak signals.
The Y-Factor method uses a calibrated noise source that applies two known noise levels, ON and OFF states, to the device input. The noise figure and, where applicable, the gain are determined from the difference between the powers measured in the two states.
Factors that influence the measurement
Accuracy and repeatability depend on the test conditions, including:
- Operating frequency and bandwidth used.
- ENR of the noise source and its calibration.
- Receiver or analyzer configuration.
- Attenuators, preamplifiers and losses present in the measurement chain.
- Temperature during the test.
- Impedance matching and RF connections.
- Calibration and stability of the measurement system.
For a complete characterization, measurements are made across the frequency range of interest. This produces a noise figure and gain curve that makes it possible to identify variations in device performance.
Applications
The service applies to low-noise amplifiers (LNAs), RF receivers, communication modules, transceivers, radio frequency front ends, wireless devices and other electronic components where sensitivity and noise performance are critical parameters.
Results are used for design validation, device characterization, component comparison, product development and RF performance analysis.