


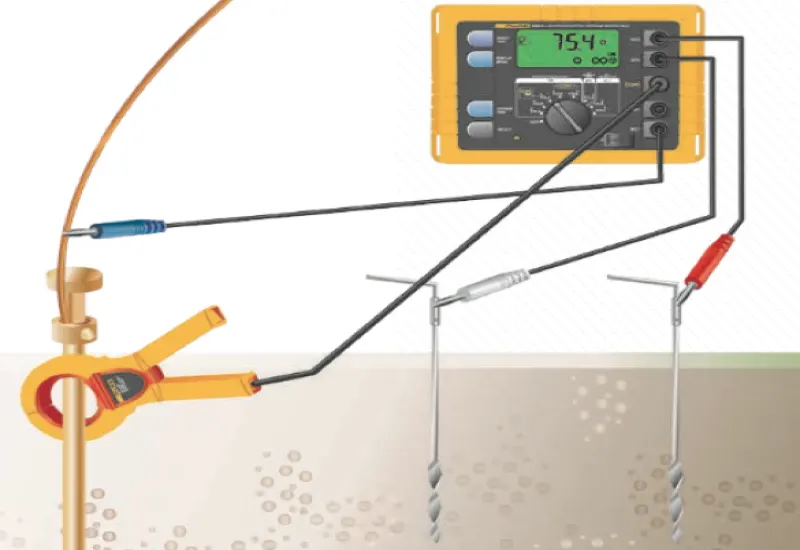
Grounding system tests and electrode resistance checks
We perform grounding system tests and electrode and lightning rod checks, approved by the Secretaría del Trabajo y Previsión Social (STPS) to carry out verification services (inspections) in occupational safety, hygiene and environment under standard NOM-020-STPS-2011. We measure with ground stakes or with clamps, to avoid drilling into the ground. We also perform soil resistivity tests using the four-pin Wenner method, with state-of-the-art professional equipment.
Professional reports
We produce professional reports on interference, thermographic and power quality analyses, among others. We characterize radio frequency components. We carry out grounding studies and transformer tests, including turns ratio and winding insulation tests up to 10Kv. We use state-of-the-art Fluke, Megger and Metrel equipment.
Vibration analysis
Summary
Predicting bearing defects in low-speed machines with spectral vibration analysis is a difficult task. The vibrations of these machines have low amplitude, and the noise level can make it impossible to identify those generated by defects. Laboratory tests and real case histories from pulp and paper machines show that an integrated analysis of the vibration spectrum and waveform makes it possible to detect bearing defects in low-speed machines. One case also illustrates the usefulness of the peakvue technique for analyzing high-frequency vibration.
Introduction
Today most modern industries use vibration monitoring and analysis in their predictive maintenance programs to determine the mechanical health of their machines and of their most critical elements, such as rolling bearings, bearing supports and gears, and so prevent catastrophic failures. When machines turn at low speed the analysis becomes more complicated, because the magnitude of the dynamic forces that generate the vibrations decreases with rotational speed. For example, unbalance generates a centrifugal force proportional to the square of the speed. In addition, low-speed machines tend to be larger and heavier, so the signal measured on the bearing housings usually has very low amplitude and a low signal-to-noise ratio.
To analyze these vibrations, the components of the measurement chain must be properly selected and used to obtain the best possible signal-to-noise ratio. Here, a low-speed machine means one that operates between 6 and 300 cpm (cycles per minute). Because bearings are among the most critical components and fail most often, the study focuses on diagnosing bearing defects in low-speed machines with various vibration analysis techniques.
Accuracy in diagnosing bearing failures
Bearings act as a source of noise and vibration because of varying compliance and the presence of defects, even when they are geometrically perfect. Defects are classified as distributed (surface roughness, waviness on the races and uneven rolling elements) and localized (cracks, indentations, raised spots, pitting and spalling). The vibration analysis techniques described here serve to identify localized defects. Vibrations of different frequencies are generated depending on where the defect is located: when a defective surface makes contact with its mating surface, short periodic pulses are produced, and their periodicity depends on the bearing geometry, the rotational speed and the location of the defect.
Interference analysis
According to classical physics and wave motion, interference is any correlative, bilateral action between two waves that produces an increase or decrease in the wave motion that originated them.
Electromagnetic interference can degrade the efficiency of a communications channel to the point of blocking all information transfer. In any transmission system (cable, fiber or radio frequency), noise signals must be kept from exceeding certain maximum levels, and the ratio between the desired signal and the interfering signal must be held at optimum levels.
Interferometric studies are extremely important for optimizing the performance of a network based on radio links, and cellular operators use them extensively. Their scope ranges from parametric optimization of UMTS RAN systems, through WCDMA/HSDPA air interfaces, to the correct operation of the MIMO antennas that support LTE 4G.
Electronic equipment does not work satisfactorily in the presence of transients or interference.
Transients
The main cause of failure in the electronic components of low-voltage data and control interconnection ports is electrical overstress, which usually originates in transients caused by: (1) lightning discharges; (2) switching of inductive loads, or (3) electrostatic discharges. This overstress is caused by voltages from tens of volts to several thousand volts, lasting from a few tens of nanoseconds to a few hundred microseconds; these are the voltage “spikes”. No buried cable, not even a power cable, is immune to transients caused by lightning.
Interference caused by harmonics
Harmonics are generated by switched-mode power supplies in computers and by variable frequency drives, among other sources. Their effect on electronic equipment is mitigated by increasing conductor size, changing the design and configuration of the supply transformer and using active filters. Passive filters made of capacitors and inductors are generally not effective (except as protection for capacitor banks), because the filter cutoff frequency has to be very close to the fundamental, which is practically impossible to design with this type of filter.
Radio frequency interference
Radio frequency interference (RFI) is mainly caused by radio transmissions, but it is also produced by electronic components that work at high frequencies. In electronic equipment its effect is minimized with good shielding on cables and equipment, although the best way to eliminate RFI is to shield the noise directly at its source. To be effective, shields must be connected to the system ground.
Thermographic analysis
Infrared thermography is the technique of acquiring and analyzing thermal information obtained with thermographic cameras. With temperature as the control variable, it is possible to detect anomalies in processes and installations in industry, as well as construction defects in buildings.
One of the most common causes of breakdowns in industry is defective electrical connections. Thermographic inspection detects these anomalies and makes it possible to schedule corrective actions before the breakdown occurs.
Power quality analysis
Frame of reference
Industrial automation, power electronics in particular, has produced high-capacity, high-performance, low-cost equipment that consists of nonlinear loads very sensitive to variations in the electrical supply. These loads disturb the power delivered by the distribution companies. The product power quality analysis is carried out in accordance with Regulation No. CONELEC 004/001, and the influence of current harmonics in accordance with the international standard IEEE Standard-519-1992. The results of the measurements by the Planning Department of CNEL-Milagro and a simulation of the effect of current harmonics make it possible to draw conclusions for keeping electrical equipment and associated processes running continuously, safely and properly.
In technical terms, the subscriber expects from the provider (the distribution company) a supply with balanced, sinusoidal voltages of constant amplitude and frequency. This approach focuses on power quality as affected by waveform distortion (harmonics) and voltage fluctuations (flicker), with conclusions on possible solutions in use today. The study is guided by Regulation No. CONELEC 004/01 and by measurements taken at the points that regulation stipulates. Data were collected with the Topas 1000 power analyzer, using the parameters of the regulation, to provide a product quality study for CNEL-Milagro in accordance with regulations in force or applied in the country.
Basic power quality study
Objective. To evaluate power quality problems (transients, harmonics, voltage regulation, consumption, power factor, grounding system review and dynamic voltage fluctuations) in order to determine the effect on the system and on end equipment, and to verify compliance with CFE provisional standard L0000-45, “permissible disturbances in the voltage and current waveforms of the electric power supply”.
The analysis must focus on complying with the main national and international standards, and includes the following points.
Preliminary analysis
The history of all problems attributed to poor power quality is discussed with the users.
Visual inspection
A visual inspection and a survey of the electrical installation and the affected equipment are carried out.
Measurements
Field measurements are carried out in the following stages. All are performed under normal load conditions.
Neutral and ground
- Measurement of the neutral and ground conductor.
- Potential difference between neutral and ground.
Electrical parameters
- Voltage per phase and three-phase.
- Current per phase and three-phase.
- Power factor per phase and three-phase.
- Displacement power factor.
- Active power per phase and three-phase.
- Apparent power per phase and three-phase.
- Reactive power per phase and three-phase.
Harmonics
- Total harmonic distortion in voltage and current per phase.
- Harmonic content in voltage and current up to the 50th harmonic in each phase.
- Total harmonic distortion in the neutral and ground conductors.
- Individual harmonic distortion up to the 50th harmonic in the neutral and ground conductors.
Transients
Voltage and current transients are measured simultaneously on all phases. All transient events must be captured with at least one-cycle resolution, with simultaneous recording of each phase.
- Minimum, average and maximum voltage profile.
- Overvoltages and voltage drops.
- Sags.
- Swells.
- Impulses.
- Microinterruptions.
Measurement equipment
- Fluke brand power analyzer, model 435 II Class A, standard EN 50160.
- LISN Line Impedance Stabilization Network, Wayne brand, model LSN30B.
- Megger TTR25 Transformer Turn Ratio tester.
- Fluke brand insulation tester, model 1507.
- Current clamps available in 200 A, 1000 A, 2000 A and 3000.
- Personal computer (laptop), multimeter and general tools.
Engineering, report preparation and presentation of results
A report is delivered that details:
- Objective of the study.
- Methodology used to prepare the report.
- Development of the study, with the measurement results in tables and graphs of:
- Voltage and current waveforms per phase.
- Total harmonic distortion in voltage and current.
- Individual distortion up to the 50th harmonic in voltage and current.
- K-factor.
- Overcurrent generated by harmonics.
- Distribution equipment losses due to harmonics.
- Behavior of electrical parameters over time (voltage, current, power factor, active, reactive and apparent power).
- Percentage of voltage and current unbalance.
- Percentage of voltage regulation.
- Load flow.
- Transients that occurred.
- Events, with type, time of occurrence, duration and magnitude (sags, swells, impulses, microinterruptions).
- Voltage and current profile.
- Current, voltage and harmonic levels in the neutral and ground conductor.
- Final conclusions and recommendations:
- Current status of the power factor and recommendations for optimizing it.
- Effect of harmonics on the system.
- Effect of transients on your system.
- Problems detected from other causes, such as overvoltage and unbalance.
- Analysis of the results against the main national and international standards.
- Solutions to each problem detected, with recommendations and suggestions for the necessary equipment.
A meeting at the end of the study is planned to discuss the report and clear up any questions.