


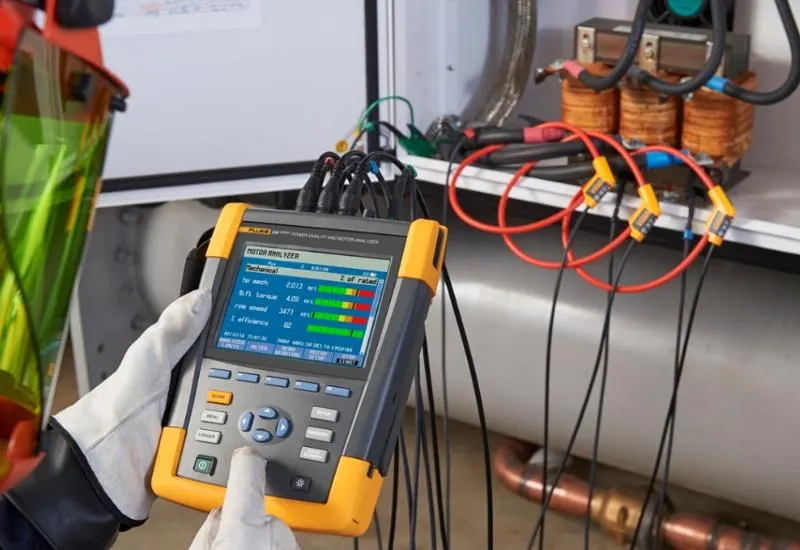
Power quality equipment from Fluke, Hioki and Circuitor
We perform power quality services and analysis on single-phase and three-phase electrical systems, as well as analysis in accordance with Mexico’s Código de Red (grid code). We measure harmonics, transients, energy quantification, VA, power factor, displacement power factor (fundamental frequency), VARs and more, on complete systems or on individual equipment and loads.
We use Fluke 435 Series II (Class A), Hioki PW3198 and Circuitor MyeBox power quality analyzers. We also rent all types of laboratory equipment, and we sell and rent surge comparison analyzers for windings or coils.
We also inspect the windings of single-phase and three-phase transformers: insulation tests and turns ratio tests with Fluke and Megger equipment.
A laboratory open to the public
We are 100% transparent. We film our work procedures on video, and you may attend and witness the analyses live.
Videos and social media
Our power quality videos on YouTube:
- https://www.youtube.com/watch?v=2rVtMQKeY0M&t=292s
- https://www.youtube.com/watch?v=PEetpoUNuzU&t=9s
- https://www.youtube.com/watch?v=n065zv_Ah24&t=422s
- https://www.youtube.com/watch?v=tP2eTXT5hfM
Facebook: https://www.facebook.com/creativieit/
What we measure in three-phase analysis
Waveforms and phasors
Scope mode shows the voltages and currents of the power system under test as waveforms or as a vector diagram. It also shows numeric values: phase voltages (rms, fundamental and at cursor), phase currents (rms, fundamental and at cursor), frequency and the phase angles between voltages and currents. Scope and phasor modes can be used alongside another active measurement, such as volts/amps/hertz, without interrupting the recording of readings.
Volts, amps and hertz
Volts/Amps/Hz shows a meter screen with the relevant numeric measurement values. The related trend screen shows how all those values change over a period of time. Events, such as fluctuations, are listed in a table. The screen gives a summary of voltages and currents on all phases. Rms voltages are shown neutral-to-line and line-to-line, along with frequency and crest factors.
The crest factor (CF) indicates the amount of distortion: a CF of 1.41 means there is no distortion, and a value above 1.8 means high distortion. Use this screen to get a first impression of power system performance before examining it in detail with other measurement modes.
Voltage fluctuations, swells and dips
This function records voltage dips, interruptions, rapid voltage changes and voltage swells. Fluctuations (dips) are rapid deviations from the normal voltage. The magnitude can range from ten to hundreds of volts. The duration can vary from half a cycle to a few seconds, as defined in EN61000-4-30.
Harmonics
Harmonics and interharmonics are measured and recorded up to the 50th. Related data are also measured, such as DC components, THD (total harmonic distortion) and K-factor.
Harmonics are periodic distortions of power, current or voltage sine waves. A waveform can be considered a combination of several sine waves with different frequencies and magnitudes. The way these components affect the signal is the measured parameter. Readings can be shown as a percentage of the fundamental, as a percentage of all harmonics combined (rms value) or as an rms value, on a bar graph, meter or trend screen.
Power and energy
A meter screen is displayed with all the relevant power parameters. The related trend screen shows how all values change over a period of time. An event table lists all threshold voltage crossings, and the analyzer also shows energy use.
Power calculations are made for Fundamental and Full. Fundamental considers voltage and current at the fundamental frequency only (60, 50 Hz or 400 Hz on the Fluke 437-II); Full uses the complete frequency spectrum (true rms voltage and current).
Inverter efficiency
Measures the efficiency and the amount of energy delivered by inverters that convert single-phase DC into single-phase or three-phase AC, such as those in solar panel systems, variable speed drives and uninterruptible power supply (UPS) systems. The measurements cover the DC current and voltage feeding the inverter input, the AC output current and the three phase-to-phase voltages (A/L1, B/L2, C/L3).
Unbalance or imbalance
The unbalance screen shows the phase relationships between voltages and currents. The results are based on the fundamental frequency component (60 Hz, 50 Hz or 400 Hz on the Fluke 437-II), using the symmetrical components method. In a three-phase electrical system, the phase shift between voltages and currents should be close to 120. The mode offers a meter screen, trend screen, event tables and a phasor diagram.
Starting or inrush currents
The analyzer captures inrush currents: overcurrents that occur when a large or low-impedance load comes online. The current normally stabilizes after a few moments, once the load reaches a normal operating state. For example, the inrush current in induction motors can be ten times the normal operating current.
It is measured with a “single-shot” mode that records current and voltage trends after a current event (the trigger). An event occurs when the current waveform exceeds the adjustable limits. The display starts from the right side of the screen, and the pre-trigger information shows what happened before the inrush current.
Energy loss calculations
The analyzer offers advanced energy use analysis to determine where losses occur and see their effect on the electricity bill. It can determine losses from several causes:
- Effective kW. Loss due to the transport of effective power, caused by wire resistance. This is the only power component that can be transferred into useful mechanical energy.
- Reactive Kvar. Loss due to reactive power that is carried through the system but does not provide active operation. The loss is caused by current flow.
- Unbalance kVA. Loss from unbalance in the source and the load. This exclusive measurement function helps reveal losses due to network unbalance. Unbalance power is the fundamental power minus the positive-sequence power.
- Distortion kVA. Loss due to distortion power (harmonics). It quickly determines the possible savings from active filtering or other system improvements. Harmonic power is the real power minus the fundamental power.
- Neutral A. Loss due to currents in the neutral conductor. Besides being a possible source of unsafe situations, such as overheating, high neutral current causes losses.
The analyzer measures these components simultaneously. The energy loss calculator uses patented algorithms to calculate the losses and put a monetary value on them.
Power quality logger and monitoring
System monitoring shows a bar graph screen indicating whether important power quality parameters meet requirements. They include:
- RMS voltages.
- Harmonics.
- Flicker.
- Voltage dips, interruptions, rapid voltage changes and voltage swells (DIRS).
- Unbalance, frequency and mains signaling.
Flicker
The flicker function is available on the Fluke 435-II and 437-II. It quantifies the luminance fluctuation of lamps caused by supply voltage variations. The algorithm complies with the EN61000-4-15 standard and is based on a perception model of the sensory system of the human brain and eye.
The analyzer converts the duration and magnitude of voltage variations into an “annoyance factor” caused by the resulting flicker of a 60 W lamp. A high reading means that most people would find the luminance changes irritating, even if the voltage variation is relatively small. The measurement is optimized for lamps powered at 120 V / 60 Hz or 230 V / 50 Hz. The meter screen shows the flicker parameters per phase, and the trend screen shows the changes in all values.
Transients
The Fluke 435-II can capture high-resolution waveforms during various disturbances. It delivers a snapshot of the voltage and current waveforms at the exact moment of the disturbance, so they can be seen during voltage dips, swells, interruptions and transients.
In transient mode, the analyzer uses a special setting of its input circuit to capture signals of up to 6 kilovolts in amplitude. Transients are fast spikes in the voltage waveform; they can carry so much energy that sensitive electronic equipment is affected or damaged. The screen resembles that of an oscilloscope, but its vertical section is expanded to show the spikes superimposed on the 60 or 50 Hz sine wave. A waveform is captured each time the voltage (or rms current) exceeds the adjustable limits. A maximum of 9,999 events can be captured. The sampling rate for detecting transients is 200 kS/s. There is also a meter mode that shows the half-cycle rms value of voltage (Vrms), current (Arms) and frequency.
Why it is important to check power quality
Power quality indicates how well suited the installation is to support reliable operation of its loads. An electrical disturbance can affect voltage, current or frequency, and it can originate in the user’s facilities, in the user’s loads or at the utility.
Disturbances are defined by their magnitude and duration. They range from transients lasting microseconds to service outages of several hours. If the supply exceeds the operating limits, the installed equipment can malfunction or be damaged. The costs of a poor supply can be significant:
- Production losses: every time production stops, your company loses money on products that are neither manufactured nor sold.
- Damaged products: interruptions can damage work in process, which must then be reworked or rejected.
- Energy cost: utilities can apply penalties for low power factors or for high consumption peaks.
Fluke instruments for power quality analysis
Fluke offers instruments for troubleshooting, preventive maintenance and long-term logging and analysis, in industrial applications and utility networks:
- Troubleshooting instruments: clamp meters for power quality and power measurement, and single-phase and three-phase analyzers suited to predictive maintenance, verification of service quality against applicable standards, and load studies.
- Power quality loggers: determine power quality, perform load studies and capture hard-to-detect voltage events over a user-defined period.
- Power quality analyzers: detect and record every detail of disturbances, perform trend analysis and verify supply quality to Class A over user-defined intervals.
Advantages of electrical network analyzers
1. Save
- Detect and prevent excess consumption (kW h).
- Analyze load curves to see where peak energy demand occurs.
- Detect the need to install a capacitor bank, and its rating.
- Detect fraud in energy meters.
2. Prevent
They are useful for periodic maintenance of the electrical network, at low and medium voltage: viewing motor starting curves, detecting possible power transformer saturation, supply outages, poor supply quality and more.
3. Solve
They make it possible to analyze where the problem lies in the network in order to resolve nuisance tripping, residual current leakage, cable heating, resonances, harmonics, disturbances, flicker, phase unbalance and more. They also make it possible to size active or passive harmonic filters and filters for variable speed drives.
Power quality study
Objective
To evaluate power quality problems (transients, harmonics, voltage regulation, consumption, power factor, grounding system review and dynamic voltage fluctuations) in order to determine the effect on the system and on end equipment, and to verify that they comply with CFE provisional standard L0000-45, “perturbaciones permisibles en la forma de onda de tensión y corriente del suministro de energía eléctrica” (permissible disturbances in the voltage and current waveform of the electric power supply).
Power quality analysis
The analysis must focus on compliance with the main national and international standards. The basic analysis covers the following points.
Preliminary analysis
The background of all problems attributed to poor power quality is discussed with the users.
Visual inspection
A visual inspection and an information survey of the electrical installation and the affected equipment are carried out.
Measurements
Field measurements are carried out in the following stages. All are performed under normal load conditions.
Neutral and ground
- Measurement of the neutral and ground conductor.
- Potential difference between neutral and ground.
Electrical parameters
- Voltage, per phase and three-phase.
- Current, per phase and three-phase.
- Power factor, per phase and three-phase.
- Displacement power factor.
- Active power, per phase and three-phase.
- Apparent power, per phase and three-phase.
- Reactive power, per phase and three-phase.
Harmonics
- Total harmonic distortion in voltage and current, per phase.
- Harmonic content in voltage and current up to the 50th harmonic on each phase.
- Total harmonic distortion in the neutral and ground conductors.
- Individual harmonic distortion up to the 50th harmonic in the neutral and ground conductors.
Transients
Voltage and current transients are measured simultaneously on all phases. All transient events must be captured with at least one-cycle resolution, with simultaneous recording of each phase.
- Minimum, average and maximum voltage profile.
- Overvoltages and voltage drops.
- Sags.
- Swells.
- Impulses.
- Micro-interruptions.
Measurement equipment
- Fluke electrical network analyzer, model 435 II Class A.
- LISN Line Impedance Stabilization Network, Wayne brand, model LSN30B.
- Megger TTR25 Transformer Turn Ratio tester.
- Fluke insulation tester, model 1507.
- Clamp meters available in 30A, 200 A, 1000 A, 2000 A, 3000 and 6000 A.
- Personal computer (laptop), multimeter and general tools.
Engineering, report preparation and presentation of results
We deliver a professional report detailing:
- Objective of the study.
- Methodology used to prepare the report.
- Development of the study, with the measurement results in tables and graphs.
The tables and graphs include:
- Voltage and current waveforms per phase.
- Total harmonic distortion in voltage and current.
- Individual distortion up to the 50th harmonic in voltage and current.
- K-factor.
- Overcurrent generated by harmonics.
- Distribution equipment losses due to harmonics.
- Behavior of electrical parameters over time (voltage, current, power factor, active, reactive and apparent power).
- Percentage of voltage and current unbalance.
- Percentage of voltage regulation.
- Load flow.
- Transients that occurred.
- Event table with type, time of occurrence, duration and magnitude (sags, swells, impulses, micro-interruptions).
- Voltage and current profile.
- Current, voltage and harmonic levels in the neutral and ground conductors.
The report closes with final conclusions and recommendations:
- Current status of the power factor and recommendations to optimize it.
- Effect of harmonics on the system.
- Effect of transients on your system.
- Problems detected from other causes, such as overvoltage and unbalance.
- Analysis of the results against the main national and international standards.
- Solutions to each problem detected, with recommendations and suggestions for the necessary equipment.
At the end of the study, a meeting is planned to discuss the report and clear up any questions.