


Infrared thermography analysis
We have a complete electrical and electronics laboratory in the city of Monterrey. In thermography, we carry out thermographic analysis and rent thermal cameras in Monterrey and throughout Mexico.
We perform thermography tests in the infrared spectrum and recommend actions to repair or improve. We complement the studies with measurements of ambient temperature, relative humidity and wind speed, to compare the results more effectively, and we produce professional reports of all kinds.
In addition to thermography, we perform vibration and power quality analysis, grounding studies, and turns ratio and insulation tests on transformers, motors, cables, coils and more. We also perform Megger insulation tests with professional equipment in Monterrey, transformer turns ratio tests and dielectric breakdown oil tests for electrical substations. We travel throughout Mexico, for both rentals and analysis.
Thermal camera rental
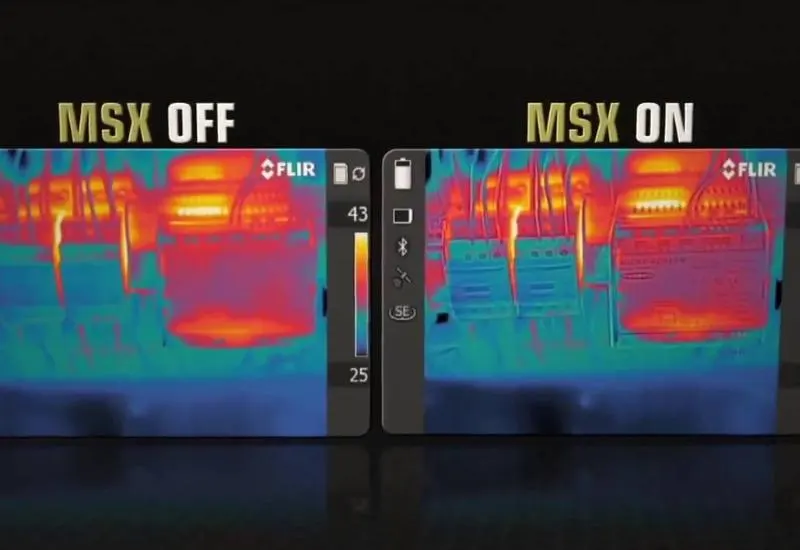
We rent professional Flir cameras with MSX and Fluke thermal cameras from immediate stock, available the same day you contact us. We are in Monterrey, but we travel anywhere in Mexico. We include international technical engineers to assist with the measurements at no extra cost, with proven experience in hazardous locations such as oil platforms and the mining industry. We hold the documentation required to enter national and international platforms. We are members of IEEE and DEIS.
We use Flir cameras, the same ones used by the U.S. Army.
Our video on YouTube: https://www.youtube.com/watch?v=nfkcLvNxO28
Another related video from Flir: https://www.youtube.com/watch?v=LeUUECmVw-s
What thermography is
A thermal camera records the intensity of radiation in the infrared zone of the electromagnetic spectrum and converts it into a visible image. Its applications vary and cover a wide field of use.
What is infrared?
Our eyes detect electromagnetic radiation in the visible light spectrum. Any other type of electromagnetic radiation, such as infrared, is invisible to the human eye.
Infrared lies midway between the visible spectrum and microwaves. The main source of infrared radiation is heat, or thermal radiation. Any object with a temperature above absolute zero (-273.15 °C or 0 Kelvin) emits radiation in the infrared region, even the coldest objects, such as ice cubes. The hotter an object is, the more infrared radiation it emits.
We are exposed to infrared rays every day: the heat from sunlight, a fire or a radiator are all forms of infrared. Although we cannot see them, the nerves in our skin perceive them as heat.
A thermal camera, or thermographic camera, displays on screen an image of the heat radiation a body emits. In recent years these cameras have gone from being an uncommon product to an accessible one, thanks to new production methods that have lowered the cost of this equipment.
How does a thermal camera work?
All bodies above absolute zero (-273 °C) emit infrared radiation (heat). In general, the greater the emitted radiation, the higher the temperature of the body. This radiation is invisible to the human eye and sits in the spectrum between visible light and microwaves. The wavelength of infrared ranges from 0.7 to 1000 microns. Within that range, thermal cameras work in the thermal infrared, between 8 and 14 microns, which corresponds approximately to -20 and 350 °C, where the most common temperatures on the Earth’s surface are found.
The camera has a thermal sensor called a microbolometer which, on receiving infrared radiation, heats up and changes its electrical resistance. That change is measured and equated to a temperature; each temperature is assigned a color, forming the colored image we see on the screen. These sensors work at room temperature and need no cooling, so they are less expensive than those for military use.
Thermal camera applications
Detecting infrared radiation, which is impossible with the naked eye, is an advantage in many situations and helps prevent failures. Non-uniform temperatures usually indicate a fault or a critical point, for example a heat leak in a pipe or increased blood flow at an internal injury in an animal. Some applications:
Industrial
- Heating of defective electrical components.
- Friction in motors or electrical machines.
- Load imbalance.
- Leaks or blockages in pipes.
- Poorly made connections.
- Prediction of fires or potential damage.
- Overload in electrical circuits.
- Tank levels.
- Critical points in ducts.
- Dangerous chemical reactions.
Construction
- Energy efficiency.
- Heat leaks.
- Dampness.
- Poor insulation.
- Leaks.
- Temperature distribution in heating systems.
Medicine and veterinary science
- Injury detection through increased blood flow.
- Locating living beings.
- Immediate detection of body temperature (fever from influenza A).
- Non-invasive medical analysis.
- Detection of nests or invasive animals in the home.
Security and other uses
- Detection of living beings in emergency situations (avalanches, earthquakes).
- Detection of possible fire sources.
- Research.
- Detection of stowaways at border crossings.
- Security perimeters.
- Invasive animals in the home.
- Wildlife observation and other activities.
The instrument has a wide variety of uses; here we mention only some of those in use today.
Thermography for predictive maintenance
If you are in charge of predictive maintenance at your plant, you carry a great deal of responsibility. By anticipating which components are about to fail, you can decide when to take corrective action. Even with a thermal camera, the worst problems can stay hidden until it is too late.
Thermal cameras make the invisible visible, and problems stand out immediately. That is why many companies combine their predictive maintenance programs with thermal cameras, to keep their plants running.
Thermography on electrical panels
Overheating may be caused by:
- Loose or deteriorated connections from lack of proper torque, due to oxidation, sulfation or electric arcs.
- Conductor overloads from loads too high for the wire gauge.
- Nearly open circuits that develop resistance.
- Three-phase load imbalance and unbalances.
- Inductive heating (generally transformers and motors).
- Harmonics.
Thermography analysis in Monterrey, we travel throughout Mexico
Reduce the costs of unplanned shutdowns with tools such as infrared thermography analysis.
To detect anomalies that often cannot be seen with the naked eye, we inspect electrical installations. During the inspection we capture digital and thermal images to detect overheating from loose fasteners, dirty or uneven contact surfaces, cracked welds and phase imbalance, among other causes.
We recommend applying thermographic diagnostics before preventive maintenance or whenever a heating problem is suspected. It applies to electrical installations and equipment such as:
- substations
- transformers
- panels
- capacitor banks
- harmonic filters
- motor control centers
- among others
Benefits of thermography analysis
- Does not interrupt the electrical power supply.
- Non-contact electrical inspection.
- Highly qualified personnel.
- Prediction of electrical problems.
- Less downtime from unplanned production stoppages.
Analysis equipment rental
In Monterrey we have meters, oscilloscopes, transducers, modules, power supplies, spectrum analyzers, logic analyzers, signal generators, multimeters, field analyzers, antenna meters, current meters and thermal cameras. Brands such as Fluke, Agilent, Tektronix, Atten, Array, Rigol, Anritsu, Advantest, etc.
We can also source new and used parts and systems, fixed or portable, for analysis equipment: voltage meters, oscilloscopes, process calibrators, transducers, test and measurement equipment, three-phase power quality analysis and everything related to electronics. We have contacts in surplus sales, and we know of bankrupt companies and auctions where equipment is sometimes available at less than 10% of the current retail price. We can also source new equipment for you.
The test and measurement equipment and the special transducers we sell, used or new, have current calibration. We have used Fluke industrial meters in stock. Request a free quote for whatever you need.
Definition of thermography
Infrared images usually have scales (or color tones) that represent the differences in the energy emitted by the surface of an object. As a general rule, lighter patterns are warmer and darker ones are cooler or colder. Unlike visible light images (wavelengths from 0.4 to 0.7 micrometers), infrared images capture infrared wavelengths. All bodies emit a certain amount of blackbody radiation (in infrared form) depending on their temperature. Generally, objects at a higher temperature emit more infrared radiation than those at a lower temperature.
The images are displayed on a screen and tend to be monochromatic, because a single type of sensor is used that perceives one particular infrared wavelength. They show the hottest areas of a body in white, the least hot in black, and intermediate temperatures in shades of gray.
Other infrared cameras are used exclusively to measure temperatures and process the images to show them in color, because they are easier to interpret that way. Those colors do not correspond to the infrared radiation perceived: the camera assigns them according to the intensity range of the wavelength, which is why they are called false colors or pseudocolors.
False colors have several applications, such as in cartography, where they describe the heights of the terrain: blue for the coldest parts, which are commonly the highest; red for the hottest, which are the lowest; and yellow and orange for intermediate heights. Other general applications of infrared cameras are seeing in the dark, through smoke or below ground.
There are ways of trying to avoid detection by infrared cameras, but they are not effective. Thermally insulating clothing conceals temporarily, because it gradually heats up to the temperature of its surroundings and becomes detectable. Wrapping yourself in aluminum foil or wearing wet clothing does not hide you from powerful cameras; it only confuses the readings.
Applications of thermal cameras
The cameras were originally developed for military use in the Korean War and gradually migrated to other fields such as medicine and archaeology. More recently, optical advances and sophisticated software interfaces have improved their versatility; for example, body temperature can be known instantly and, if it is above normal, an audible alarm goes off to identify the person.
Applications include:
- military and police, for target detection and data acquisition;
- security and counterterrorism;
- predictive maintenance (early detection of mechanical and electrical faults);
- process control;
- fire detection or analysis;
- automotive industry;
- floor inspection;
- acoustic insulation audits;
- wall inspection;
- medicine and diagnosis;
- non-destructive analysis;
- quality testing in production environments;
- pollution detection;
- body temperature detection, for example, for detecting influenza A;
- observation of animals in their natural habitat at night, for behavioral studies.
Causes of thermal variations
The causes of thermal variations can be real or apparent. Real causes act directly on the absolute temperature emitted by the surface. Apparent causes can lead to confusion and reading errors by altering the information the camera receives; for this reason, where possible, compensation factors or other corrective measures must be applied.
The most frequent causes of anomalies are:
- Increased resistivity from poor contacts.
- Overload in electrical components and conductors.
- Disturbances due to harmonic components in the electrical system.
- Phase imbalance.
Increased resistivity from poor contacts
Joule heating due to increased resistance can originate from deficient connections, loss of conductor cross-section, etc. As resistivity increases, temperature rises in a hot zone or hot spot, that is, a region with a temperature higher than the rest of the thermogram. This anomaly generally shows a temperature gradient that decreases at the points farthest from the connection, as seen in figure 1.
Figure 1. Progressive decrease of the thermal gradient in relation to distance from the hot spot.
In electrical installations, poor contacts are common between conductors and electrical components: switches, connection terminals, clamps, metal bars, internal contacts, fuses, disconnectors, etc. These simple anomalies create a closed cycle that can trigger a continuous rise in temperature until the elements are destroyed. The exact moment cannot be predicted, but thermography, being predictive, aims to anticipate this event.
The most frequent causes of poor contacts are:
Poorly tightened fasteners. A bad connection increases resistance and, with it, temperature. For example, on a small conductor connected to one phase of a residual-current device, overtightening can cause it to partially break and increase the resistance at that point. Conversely, if the conductor is not properly tightened, the smaller contact surface is equivalent to a reduction in conductor cross-section and generates overheating from increased resistance, as shown in figure 2.
Figure 2. Increased resistivity due to poorly tightened fasteners.
Corrosion or dirt on contacts. Because of environmental factors, metals can oxidize, get dirty or undergo sudden temperature changes that expand and contract the contact surface. This alters conductivity and increases resistance in the most affected areas. Some electrical panels lack adequate protection or are not in a recommended location. For this reason, cleaning the contact area is recommended when a poor connection is detected.
Loss of cross-section. Some conductors have partial deterioration that causes serious problems in medium- and high-voltage lines. The temperature rise promotes further deterioration, which contributes to greater loss of cross-section or to broken strands. It is a closed cycle that ends with the conductor breaking. One of the factors behind this deterioration in medium- and high-voltage lines is the corona effect.
Overload in electrical components and conductors
This is another case of increased resistivity, treated separately because of its particular nature. When the current carried by components and conductors exceeds the rated values for which they were manufactured, their surface temperature is too high, which indicates overload. Most low-voltage components specify in their datasheet their operating temperature for a given ambient temperature.
From a quantitative standpoint, these parameters make it possible to determine when a component is at the thermal limits of correct operation and to assess severity using the thermal gradient criterion, that is, its variation from an optimal reference point.
Figure 3. Thermographic image of overloaded protection devices.
An overload can also be determined by observing the images and their temperature pattern. The experience and database of a company that performs these inspections give a good reference for the condition of the component without so many mathematical calculations. Comparing temperatures between equipment or components with similar characteristics is an efficient method for detecting overloads, because it allows faster inspection, something very important in practice. Figure 3 shows an example.
Disturbances from harmonic components
In many situations the periodic steady-state waveform is not sinusoidal, in either voltage or current. These distorted waves are represented by a series of sinusoidal functions that are multiples of the fundamental wave, called harmonics. The initial cause of harmonics is the distorted currents drawn by devices with non-linear operation. Harmonics also appear in the voltage wave when non-linear loads are added.
Harmonics are generated by non-linear loads in the electrical system, which fall into three families:
- Electrical machines with magnetic saturation, especially rotating machines and saturated transformers.
- Electronic power converters.
- Equipment in which electric arcing occurs, a non-linear phenomenon.
We can check which harmonics generate heating through higher losses, which age insulation sooner, mainly in insulated cables. In general, equipment subjected to harmonic voltages or carrying harmonic currents has increased losses, so a reduction of its rated current class must be considered.
A frequent case in thermographic inspection is a high surface temperature on neutral conductors relative to the live phases. In unbalanced systems, the harmonic currents flowing through the neutral add together, and their value can reach the same order of magnitude as the live phase currents. Sometimes, even when the line is not running at full load, the neutral conductor looks hotter than the phases; this must be kept in mind so as not to mistake it for a poor contact. These harmonics in the neutral are called triplen harmonics.
Phase imbalance
Phase imbalances cause thermal problems that are detected in a proper thermographic inspection. The three phases should be symmetrical in voltages and currents, with a phase shift close to 120 electrical degrees. Imbalances occur when the RMS value of one phase does not match that of the others, and in three-phase systems they are caused by:
- Single-phase loads poorly distributed between phases.
- Uneven distribution of conductors, although with a smaller influence.
- Phase-to-ground faults.
In industry it is common to add new single-phase equipment, extend lighting, etc. Sometimes these installations do not distribute the loads well between phases and one becomes overloaded, with an effect similar to that of harmonics: the temperature rises along the entire conductor run of the unbalanced phase. The thermogram normally shows a conductor of one phase hotter than those of the other phases.
As with harmonics, it is not possible to know with certainty, just by looking at the thermogram, whether the origin of the fault is a phase imbalance. With our power quality analyzer, which allows on-site measurement, or with other measuring devices built into some electrical panels, that assumption can be ruled out or confirmed. We also offer you power quality analysis for a complete check.