


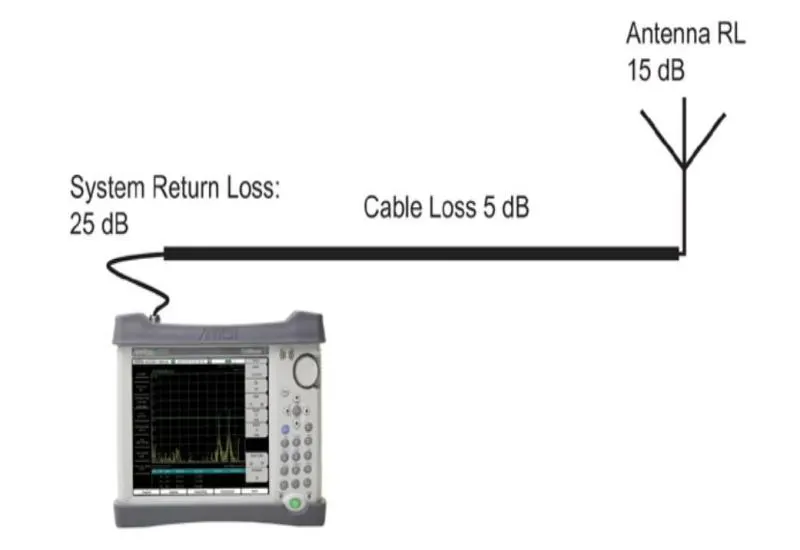
We perform all types of cable and antenna analysis: distance to fault, return loss or SWR, network analysis, insertion loss and impedance analysis.
Why analyze the cable and antenna system
The coaxial cable and antenna system is decisive for the performance of a base station. Degradation and faults in the antenna system can cause poor voice quality or dropped calls. For the operator, this can end in lost revenue.
A problematic base station can be replaced, but a cable and antenna system is not so easy to replace. The field technician must troubleshoot the cable and antenna system and verify that the communication system works as expected.
Field technicians use handheld cable and antenna analyzers to analyze, troubleshoot, characterize and maintain the system. The key measurements are return loss, cable loss and distance to fault (DTF).
FDR technology
Most modern analyzers use frequency domain reflectometry (FDR). It uses RF frequencies to analyze the data and locate changes and degradation at the operating frequency. Frequency domain analysis finds small degradations or changes in the system, so serious failures can be prevented.
Another benefit of analyzing with RF sweeps is that antennas are tested at their correct operating frequency, and the signal passes through frequency-selective devices such as filters, quarter-wave lightning arrestors or duplexers, which are common in cellular antenna systems.
Return loss and VSWR
Return loss and VSWR are key measurements for anyone measuring cables and antennas in the field. They show whether the system is matched and whether it meets engineering specifications. If problems appear in this test, the system very likely has problems affecting the end user. A poorly matched antenna reflects RF energy that is not available for transmission and returns to the transmitter. That energy distorts the signal and affects the efficiency of the transmitted power and the coverage area.
For example, a system return loss of 20 dB is very efficient, because only 1% of the power is returned and 99% is transmitted. With a return loss of 10 dB, 10% of the power is returned. Systems have different acceptable limits, but 15 dB or more is a common limit for a cable and antenna system.
Return loss
This shows the ratio of reflected power to reference power, in dB. It is usually preferred because of the advantages of logarithmic displays; one of them is that it is easier to compare a small number and a large one on a logarithmic scale. The scale normally runs from 0 to 60 dB: 0 is an open or short, and 60 dB would be close to a perfect match.
VSWR
This shows the system match linearly and measures the ratio of voltage peaks to valleys. If the match is not perfect, the peaks and valleys of the returned signal do not line up with the transmitted signal; the higher the number, the worse the match. A perfect match would be 1:1. A more realistic match for a cable and antenna system is on the order of 1.43 (15 dB). Antenna manufacturers usually specify the match in VSWR. Its scale is generally set by default between 1 and 65.
Cable loss
As the signal travels along the transmission path, part of the energy is dissipated in the cable and components. Cable loss is generally measured during the installation phase, to verify that it is within the manufacturer’s specifications.
It can be measured with a handheld vector/scalar network analyzer or a power meter, or with the return loss measurement of the cable and antenna analyzer. When a short is placed at the end of the cable, the signal is reflected and the energy lost in the cable is calculated. Manufacturers suggest obtaining the average loss over the swept frequency range by adding the peak and valley of the trace and dividing by two in cable loss mode, or by four in return loss mode (to account for the round trip of the signal).
Most current handheld analyzers have a cable loss mode that displays the average loss over the swept range. This is the preferred method, because it eliminates the calculations. For example, when measuring a cable between 1850 and 1990 MHz, markers on the peak and valley allow the average to be calculated, and the handheld instrument calculates it and shows it on screen.