


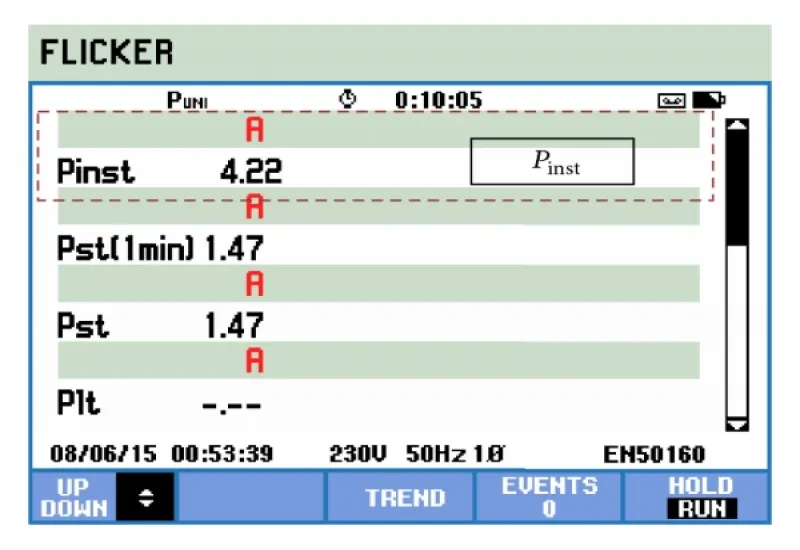
Flicker measurement with the Fluke 435 Series II Class A
The Fluke 435 Series II Class A power quality analyzer measures flicker and shows whether it is within suitable ranges. The equipment rental includes a technician experienced in its use, for greater convenience and faster data acquisition.
What causes flicker
Flicker can originate from disturbances during power generation, transmission or distribution. However, it is almost always caused by large fluctuating loads, that is, loads whose active or reactive power demand changes rapidly.
In fluctuating loads of a certain size, the main cause of voltage variations is the variability over time of the reactive component of their power. Examples: arc furnaces, rolling mill motors and large winders.
Low-power loads can also produce flicker: welders, power regulators, electric saws and hammers, pumps, compressors, cranes and elevators. Simply starting an induction motor can be classified this way, although because it is transient it does not usually have a significant lasting effect.
In general, these are loads with a high ratio of power change to short-circuit capacity at the point of connection to the supply network. In power quality studies, that point is called the point of common coupling, when relating a polluting load to a sensitive one.
Effects of voltage fluctuations on light sources
In electric light sources, any variation in the supply voltage alters their luminous flux. To express this, the literature proposes an index that relates the variation in light amplitude to the variation in applied voltage, called the gain factor.
This factor shows that incandescent sources are especially sensitive to supply voltage variations, while low-pressure sodium vapor lamps are the least sensitive. In this way each light source is characterized by how much it transfers voltage variations to its luminous flux.
Physiological effects of luminous flux fluctuations
The most important effect is physiological: it affects the ergonomics of the production environment and causes fatigue and reduced concentration in workers. The eye-brain combination responds like a band-pass filter between 0.5 Hz and 35 Hz, with maximum sensitivity around 8-9 Hz. The effects depend on the amplitude of the variations, the frequency spectrum and the duration of the disturbance.
The brain’s response to a light stimulus is inertial, with a time constant of about 300 ms. Slow variations are perceived, while fast ones are smoothed out. For example, two short variations occurring within a 300 ms interval are perceived as one.
The response to flicker varies from person to person. For this reason, to quantify it, the standards adopt a fully electronic standardized instrument that models a tungsten light source together with the human response. The first instruments were based on simple observation of luminous flux. A model of human reaction was then developed, which shows up as discomfort or annoyance. The model takes as its reference a 60 W tungsten filament incandescent lamp supplied at 230 V.
Perception threshold curves
The Fluke shows two flicker perception sensitivity thresholds, for two nominal supply voltages. The graph is defined by the percentage of voltage variation (vertical axis) and the frequency of that variation (horizontal axis).
If the point defined by the magnitude and frequency of the variations falls above the adopted threshold curve, the effect is likely to be annoying to the vast majority of observers. If it falls below, it will most likely be imperceptible.
Each nominal voltage has a different curve. Between two lamps of the same power, more current flows through the one operating at the lower voltage (120 V) than through the one at the higher voltage (220 V). The former has greater thermal inertia and is less affected by the same variation in nominal voltage.
In the measurements, the 230 V threshold curve is adopted, since the nominal voltage of the installation is 220 V.
Standardized limits for flicker severity
IEC 61000-3-3
- The short-term flicker severity index must be PST (Short Term Perceptibility) ≤ 1.0.
- The long-term flicker severity index must be PLT ≤ 0.65.
EN 50160
- The long-term index must be PLT ≤ 1.0 for 95 % of the measurement period (one week).
- The short-term index, PST, is not taken into account.
ENRE (Ente Nacional Regulador de la Electricidad) Resolution No. 184/2000
- The short-term index must be PST ≤ 1.0 for 95 % of the measurement period (one week).
Reducing flicker
When the flicker severity in an installation exceeds the limits in the standards, or reaches worrying values, it is advisable to reduce the amplitude of the fast voltage fluctuations. The strategies fall into two families.
Increase the short-circuit power at the connection point of the fluctuating load
In practice, this means:
- connecting the load to a higher nominal voltage level;
- supplying these loads with independent, dedicated lines;
- increasing the rated power of the transformer that supplies the fluctuating load;
- separating the lines of the fluctuating loads from those that supply sensitive loads, connecting them to separate secondary windings of a three-winding transformer;
- installing series capacitors, taking care in their sizing to avoid problems during transients such as system short circuits.
Reduce reactive power flow variations
This is achieved by installing dynamic compensators or stabilizers based on power electronics.